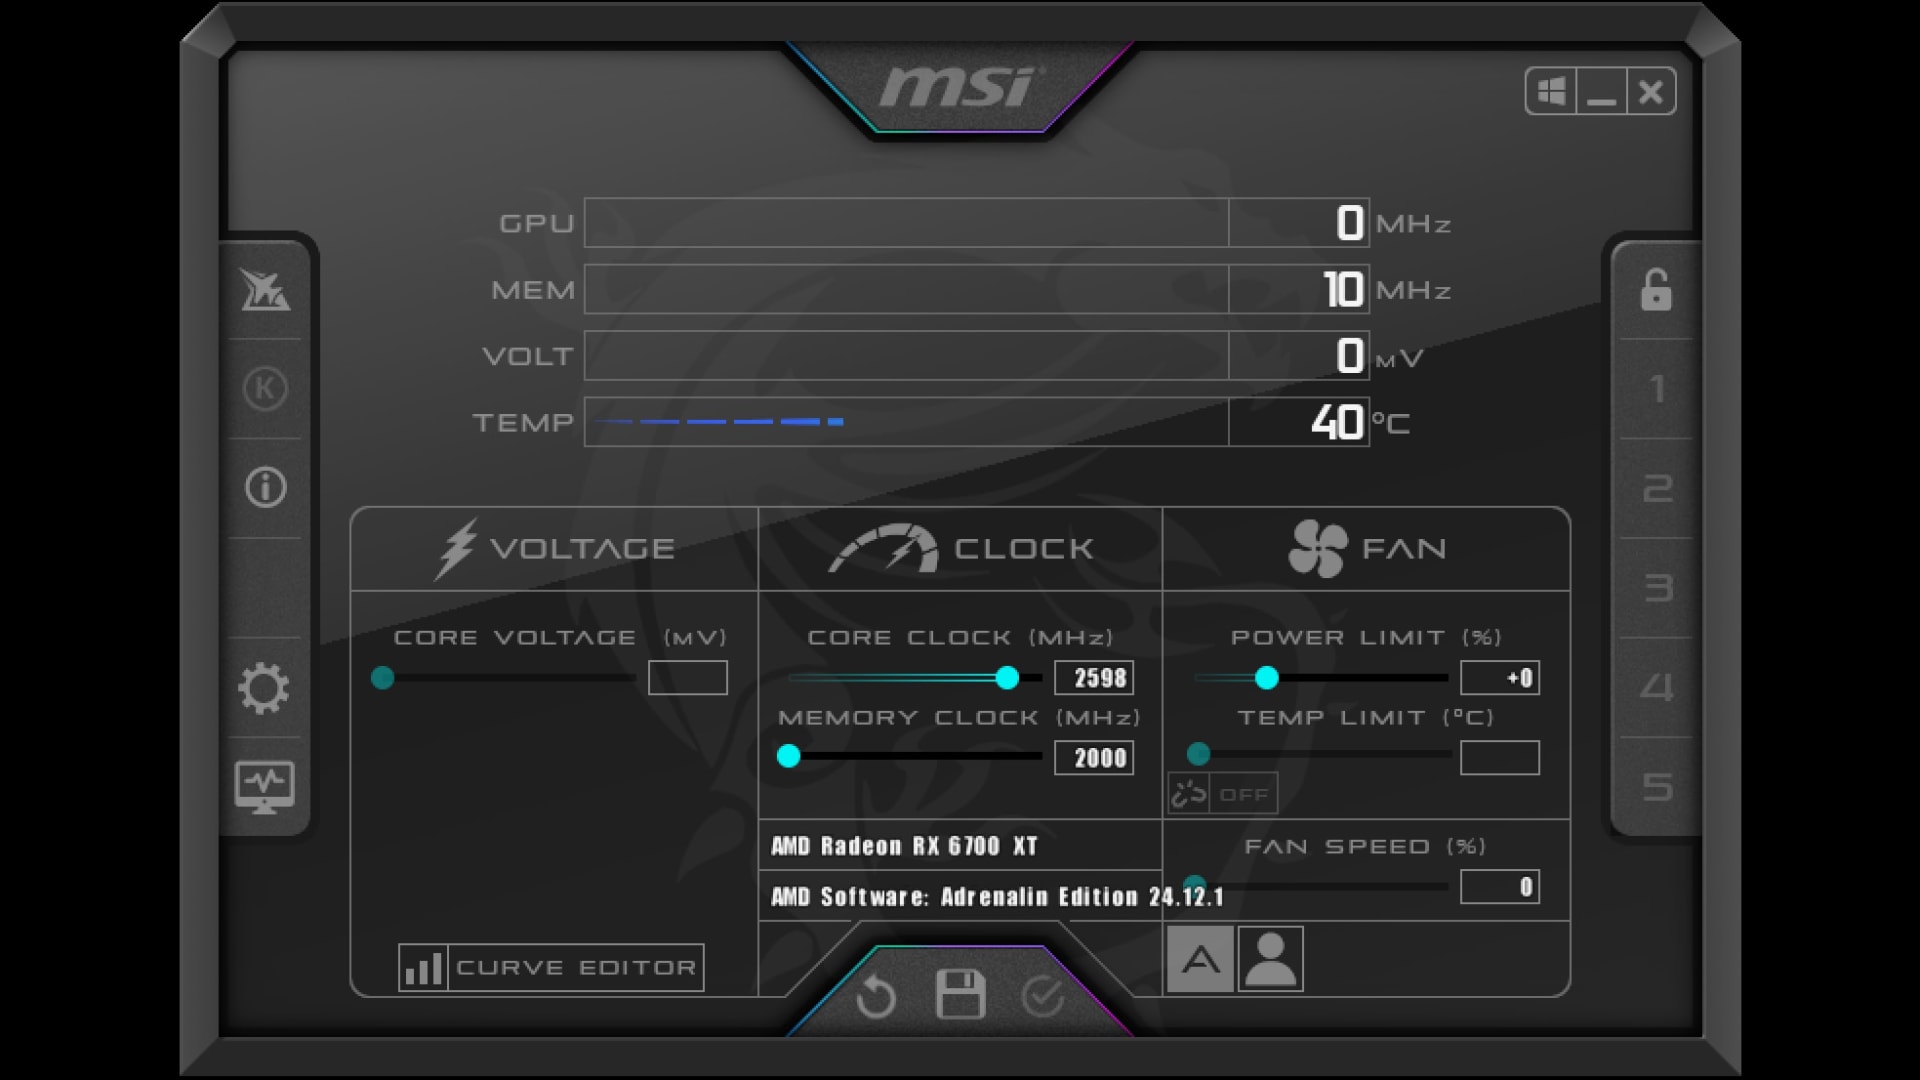
GPU usage sitting at 50% while your frame rate disappoints does not mean your graphics card is broken or throttled. It means something else in the chain is setting the pace, and the card is waiting. Low utilisation is the shadow the real bottleneck casts, which is why chasing the utilisation number directly almost never helps.
The useful question is not "why is my GPU usage low" but "what is my GPU waiting for." There are only about six answers, and a single sixty-second test separates them into two groups before you change a thing.
Note
Key Takeaways
- GPU usage is an occupancy figure, not a measure of how hard the card is working.
- The most common cause is a CPU bottleneck — the card finishes early and idles waiting for the next frame.
- Overall CPU usage hides this. A single core at 100% with the total at 30% is still a hard limit.
- Raise the resolution. If frame rate stays flat, you were never GPU-limited.
- A frame cap, V-Sync, or Reflex producing low GPU usage is correct behaviour, not a fault.
- Intel's GPU Busy metric answers this directly in a way utilisation percentages cannot.
What GPU Usage Actually Measures
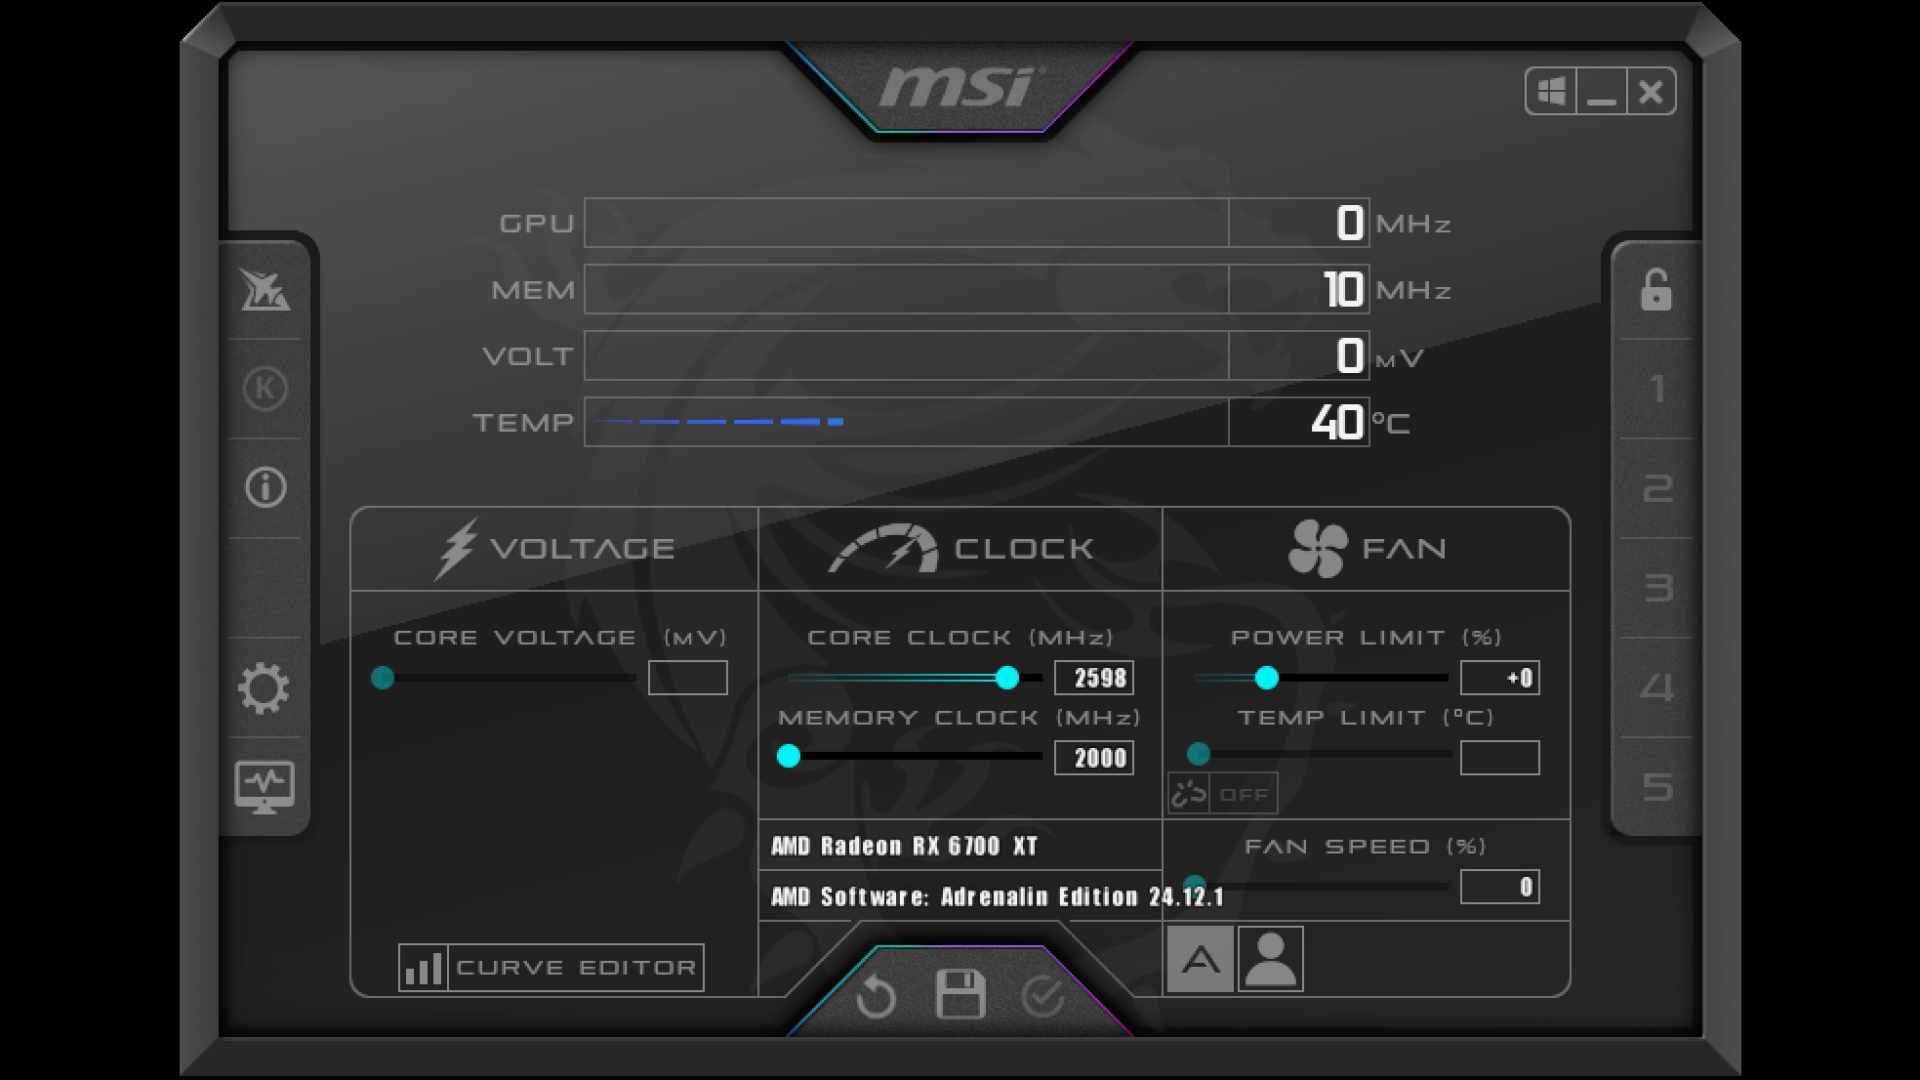
The number Task Manager and MSI Afterburner report is closer to "was the GPU doing anything at all during this sampling window" than "how much of the GPU's capability was used."
A card can report 100% while running a trivial workload that occupies one part of the chip, and it can report 60% while genuinely limited by a bottleneck inside its own pipeline. The figure is an availability sample, not a throughput measurement, which is why two systems showing identical utilisation can perform completely differently.
For diagnosis this matters in one specific way. Low GPU usage reliably tells you the card has idle time. It tells you nothing about why. Everything useful comes from identifying what fills that idle time.
The Metric That Actually Answers This
Intel's PresentMon introduced a metric that sidesteps the whole utilisation problem: GPU Busy. Instead of sampling occupancy, it reports how many milliseconds the GPU spent working on each frame, in the same unit as the frame time itself.
That makes the comparison direct. If a frame took 16ms and GPU Busy reports 15.5ms, the GPU was working almost the entire frame and you are GPU-bound. If the frame took 16ms and GPU Busy reports 8ms, the card finished in half the time and spent the rest waiting — the other 8ms belongs to the CPU.
Watching the gap between those two lines is the fastest reliable diagnosis available, and PresentMon is free and vendor-neutral despite the Intel branding. It works on NVIDIA and AMD hardware.
Tip
If you install one diagnostic tool for this, make it PresentMon rather than another FPS overlay. The frame time versus GPU Busy delta answers in ten seconds what utilisation percentages leave ambiguous indefinitely.
The Sixty-Second Test
Before installing anything, run this. It requires no tools and it splits the problem cleanly.
Raise your resolution or graphics settings and watch what happens to the frame rate.
If frame rate drops meaningfully, you were GPU-limited and the utilisation figure was misleading you. If frame rate stays essentially flat while your GPU usage rises, you were never GPU-limited — something upstream is capping you, and adding graphical load simply used capacity that was already idle.
That second outcome is the one people find counter-intuitive and it is also the more common. It means you can turn settings up for free, and it means the fix lies elsewhere entirely.
Cause 1: The CPU Cannot Feed It Fast Enough
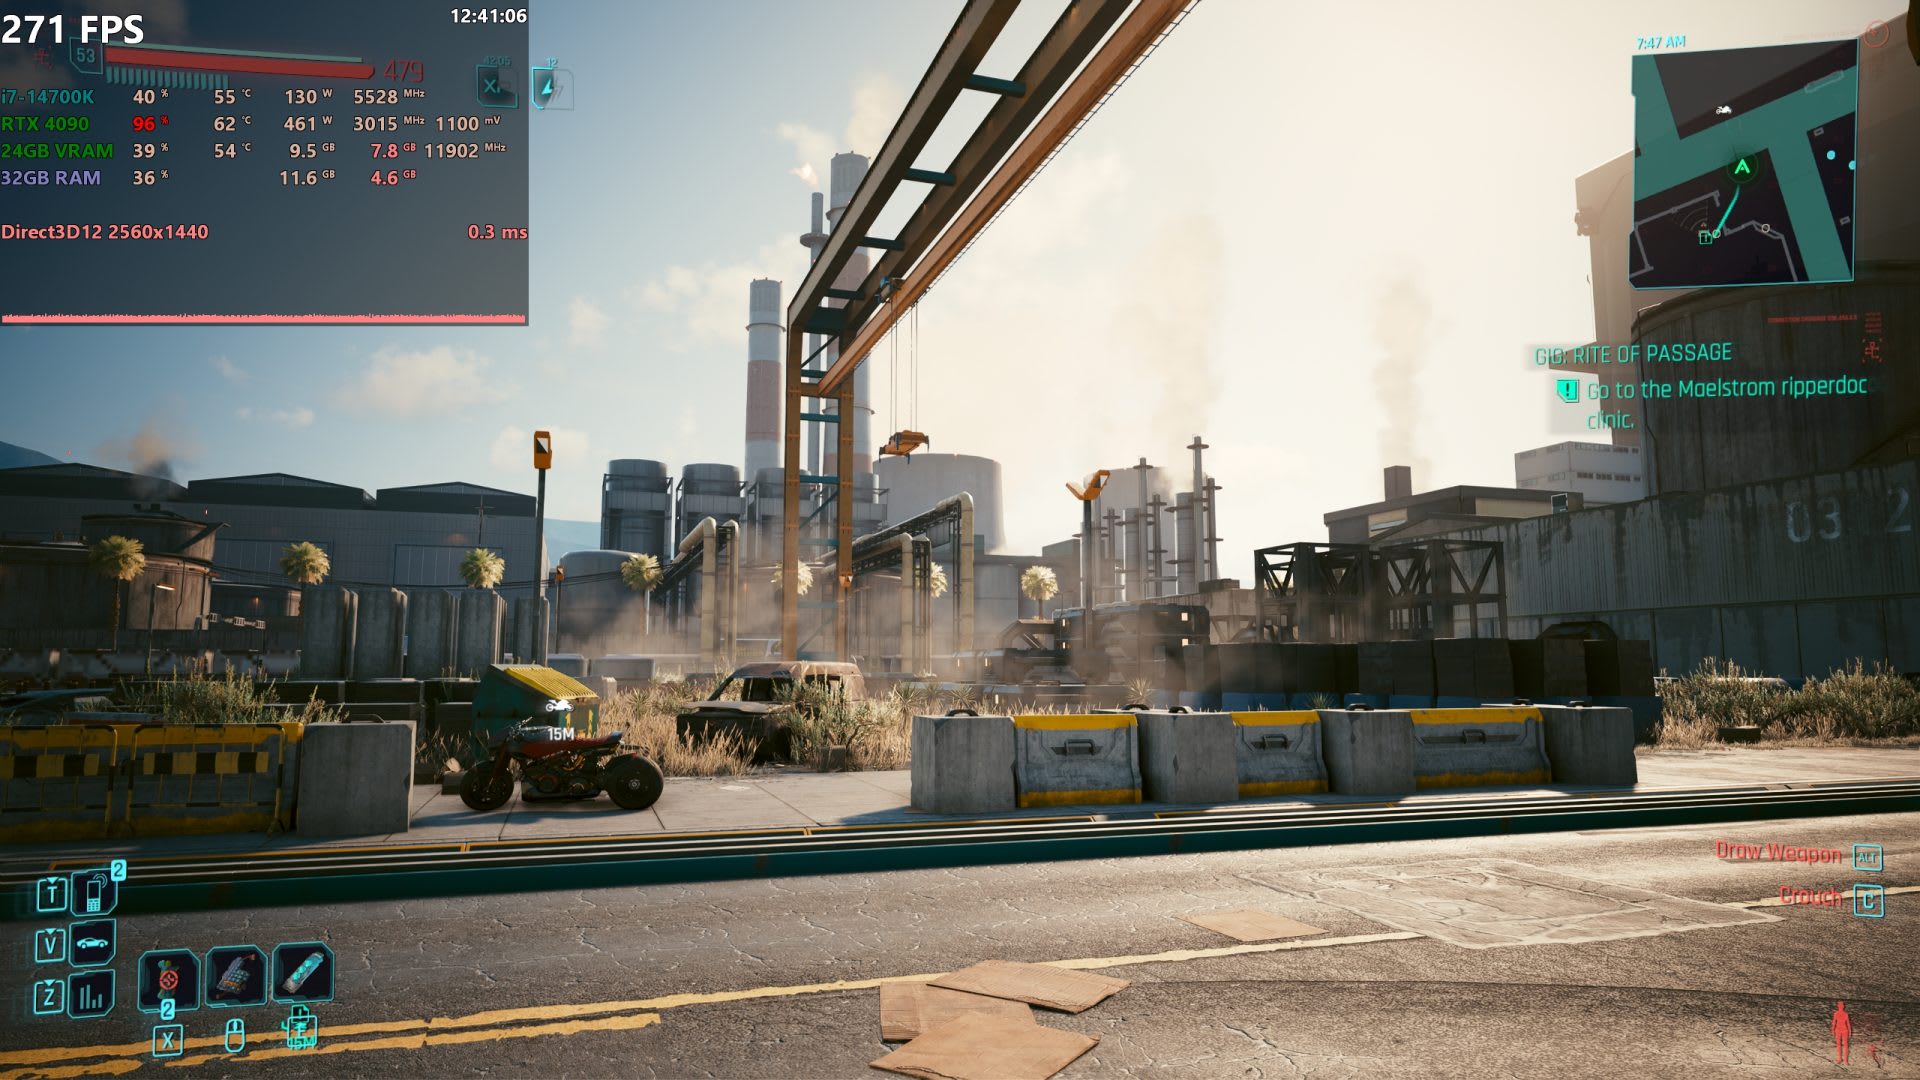
This is the leading cause by a wide margin, particularly at 1080p and with high-refresh targets, and it has a specific tell that most people miss.
Overall CPU usage is a misleading number here. Games depend heavily on a small number of threads, and one saturated core is a hard ceiling regardless of what the other fifteen are doing. Task Manager showing 25% overall while one logical processor sits at 100% is a textbook CPU bottleneck.
To see it, open Task Manager → Performance → CPU, right-click the graph and choose Change graph to → Logical processors. Watch during gameplay. If any single core is pinned near 100% while GPU usage languishes, that is your answer.
Certain genres make this unavoidable rather than fixable. Simulation games, strategy titles with large unit counts, open-world games with dense NPC logic, and heavily modded games are CPU-bound by design. Lowering graphics settings in those cases does nothing at all, which is itself a useful confirmation.
The perceptual cost also shows up in frame consistency rather than averages, which is why our guide to what 1% lows measure is the right companion metric when you are diagnosing this.
Cause 2: You Capped It Yourself
Before treating low utilisation as a fault, rule out the possibility that it is exactly what you asked for.
A frame rate limiter, V-Sync at your refresh rate, or NVIDIA Reflex all deliberately stop the GPU from producing frames faster than needed. A card holding 55% usage while sitting precisely on a 120 FPS cap is behaving perfectly. Low usage plus a frame rate pinned to a round number is the signature.
This matters because a properly configured variable refresh setup intentionally caps slightly below your maximum refresh rate, and that cap will hold GPU usage below 100% in lighter scenes. Our guide to G-Sync, V-Sync and frame cap settings covers why that cap is desirable and what the correct configuration is.
Frame generation muddies this further by producing frames the GPU did not fully render — see frame generation and input lag for what that does to both the numbers and the feel.
Cause 3: Power and Thermal Limits
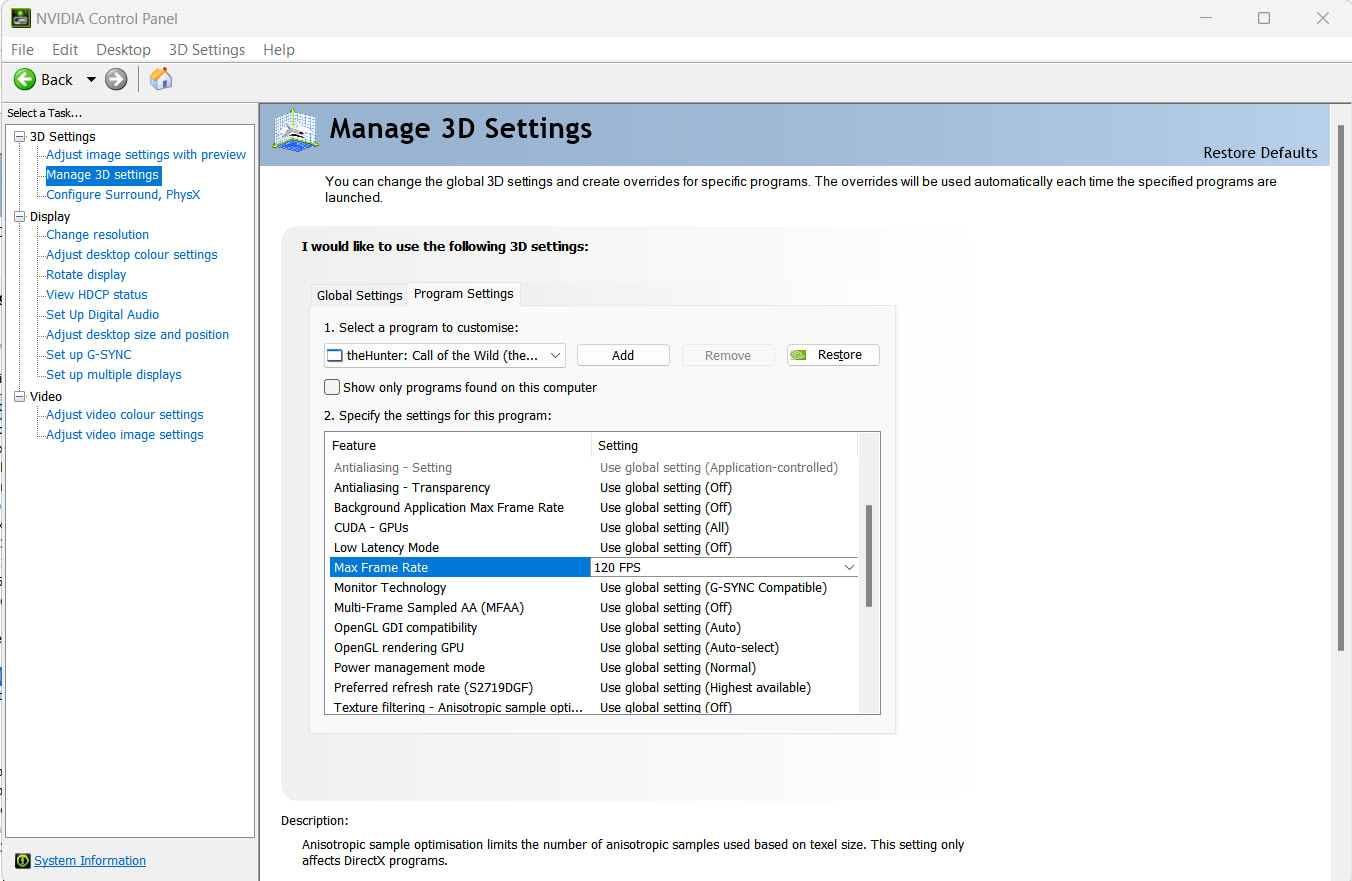
A card that is thermally or power limited reduces its clocks rather than its reported utilisation, so this cause hides from the metric people are watching.
The tells are in the other sensors. Watch GPU core clock, temperature, and board power draw together during a long session. Clocks stepping down over several minutes while temperature climbs indicates thermal throttling. Clocks oscillating rapidly while power draw sits pinned at a ceiling indicates a power limit.
A related and nastier variant is an inadequate or failing power supply, which produces transient shutdowns rather than clean throttling. If your machine cuts out entirely under load rather than merely slowing, that is a different investigation — why a PC shuts down while gaming covers it in test order.
Cause 4: The Game Is Running on the Wrong GPU
On any system with integrated graphics — which is most laptops and a large share of desktops — the game may simply not be using the card you are watching.
The signature is unmistakable once you look for it: dedicated GPU usage near zero, poor frame rates, and a machine that behaves like it has no graphics card at all. It happens most often on laptops after a driver update, and on desktops when the monitor is plugged into the motherboard's video output rather than the graphics card's.
Our guide to games running on integrated graphics instead of your GPU covers both the Windows graphics preference setting and the physical cable check. If your monitor is also stuck at 60Hz, that is the same root cause showing two symptoms — see why a 144Hz monitor runs at 60Hz.
Cause 5: Data Cannot Reach the Card
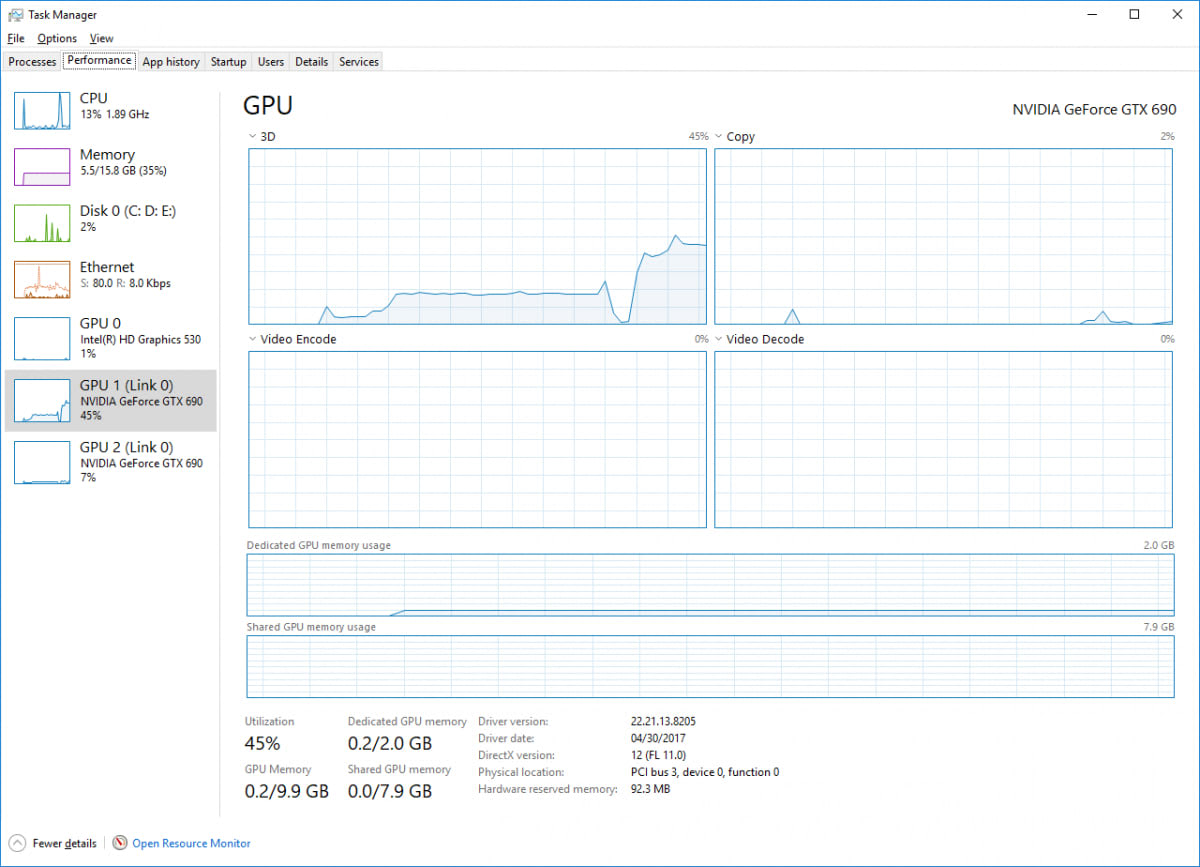
Less common, but real, and it produces low utilisation with a distinctive stuttering character rather than a uniformly low frame rate.
A graphics card in a physically or electrically restricted PCIe slot has less bandwidth to work with. This rarely matters much for modern cards at x8 or x16, but it becomes significant on cards with small frame buffers that need to stream assets across the bus continuously. Our comparison of PCIe 5.0 versus PCIe 4.0 for gaming covers where the difference is measurable and where it is marketing.
The related and far more common version is VRAM exhaustion. Once a game exceeds the card's memory it begins swapping across the bus, and the resulting pattern is low GPU usage with severe hitching. How much VRAM you need for gaming covers the thresholds where this starts to bite.
Cause 6: Something Else Is Using the Machine
Background load competes for exactly the CPU time the game needs, and because it is intermittent it produces intermittent low GPU usage rather than a steady state.
Shader compilation is the most common and the most misread. Stutter that appears in new areas and improves on a second pass is compilation work, not a bottleneck — whether you should clear your shader cache explains why the usual advice about this is generally backwards. Recording and streaming software, browser tabs with video, and aggressive real-time antivirus scanning all produce the same shape of interference.
Overlays deserve a specific mention because they are so widely installed and so rarely suspected. Our look at whether Discord lowers your FPS covers what its overlay and hardware acceleration actually cost.
Putting It in Order
| # | Check | Points to |
|---|---|---|
| 1 | Raise resolution — does frame rate hold? | Not GPU-limited |
| 2 | Per-core CPU graph — any core pinned? | CPU bottleneck |
| 3 | Frame rate sitting on a round number? | Your own cap |
| 4 | GPU clocks, temperature, board power | Thermal or power limit |
| 5 | Which GPU is the game actually using? | Wrong adapter |
| 6 | VRAM usage against card capacity | Memory exhaustion |
| 7 | PresentMon frame time versus GPU Busy | Confirms 1 through 6 |
Rows 1 and 2 identify the majority between them. Row 7 is the one that turns a guess into a measurement, and it is worth running even when you think you already know the answer.
When Low GPU Usage Is Fine
It is worth saying plainly, because the number attracts more worry than it deserves: a GPU that is not at 100% is not a problem in itself.
If your frame rate is comfortably above your refresh rate, or sitting on a deliberate cap, low utilisation means you have headroom. The card is idle because there is nothing left to do. The only version of this worth investigating is low GPU usage alongside a frame rate you are unhappy with — and in that case the utilisation figure is a starting clue, never the diagnosis.
Frequently Asked Questions
What GPU usage should I see while gaming?
If you are GPU-limited and want to be, 95-100% is normal and healthy. Anything below roughly 90% with an unsatisfying frame rate means the card has idle time and something upstream is the limit. If your frame rate is already where you want it, low usage simply means spare capacity.
Does low GPU usage mean my graphics card is faulty?
Almost never. A faulty card usually produces crashes, artefacts, or driver resets rather than tidy low utilisation. Low usage with stable output points to the card waiting on something else — most often the CPU, a frame cap, or a game running on the wrong adapter entirely.
Why is my GPU usage low but my CPU usage is also low?
Because overall CPU usage averages across every core and hides single-thread saturation. Switch Task Manager to the logical processors view and look for one core pinned near 100%. If none is, look next at a frame cap, V-Sync, or Reflex holding the frame rate down deliberately.
Will upgrading my CPU fix low GPU usage?
Only if the diagnosis confirms a CPU bottleneck, and only for the games where it applies. Verify first with the resolution test and the per-core graph. If raising resolution leaves your frame rate flat and a core is pinned, a faster CPU will help. If neither is true, a CPU upgrade changes nothing.
Does low GPU usage cause stuttering?
Not directly, but they frequently share a cause. A CPU bottleneck, VRAM exhaustion, and shader compilation all produce low GPU usage and uneven frame delivery together. The stutter comes from the inconsistent frame times, not from the utilisation figure itself.
Should I use PresentMon or MSI Afterburner?
They answer different questions. Afterburner is convenient for watching clocks, temperatures, and power draw. PresentMon's GPU Busy metric is what actually separates CPU-bound from GPU-bound, because it compares GPU working time against total frame time directly rather than sampling occupancy.
The Bottom Line
Stop treating the utilisation percentage as the problem. It is a clue that the card has idle time, and the entire diagnosis is about identifying what fills that idle time.
Run the resolution test first. Sixty seconds and no software tells you whether you are GPU-limited at all, and it rules out the largest category of confusion in one step. If the frame rate holds steady as you add graphical load, the card was never the constraint — turn your settings up, then go and look at your CPU, your frame cap, and which adapter the game is actually using.
Sources
- Intel, Intel PresentMon, retrieved 2026-08-13, https://game.intel.com/us/stories/intel-presentmon/
- Intel GameTechDev, PresentMon on GitHub, retrieved 2026-08-13, https://github.com/GameTechDev/PresentMon
- Intel Support, High CPU Usage but Low GPU Usage, retrieved 2026-08-13, https://www.intel.com/content/www/us/en/support/articles/000092878/graphics.html
- XbitLabs, Understanding Bottlenecks — GPU Busy and Intel PresentMon, retrieved 2026-08-13, https://www.xbitlabs.com/blog/gpu-busy/
- Wccftech, CPU or GPU Bottleneck? How to Diagnose What's Really Limiting Your Gaming Performance, retrieved 2026-08-13, https://wccftech.com/how-to/cpu-or-gpu-bottleneck-how-to-diagnose-whats-really-limiting-your-gaming-performance/