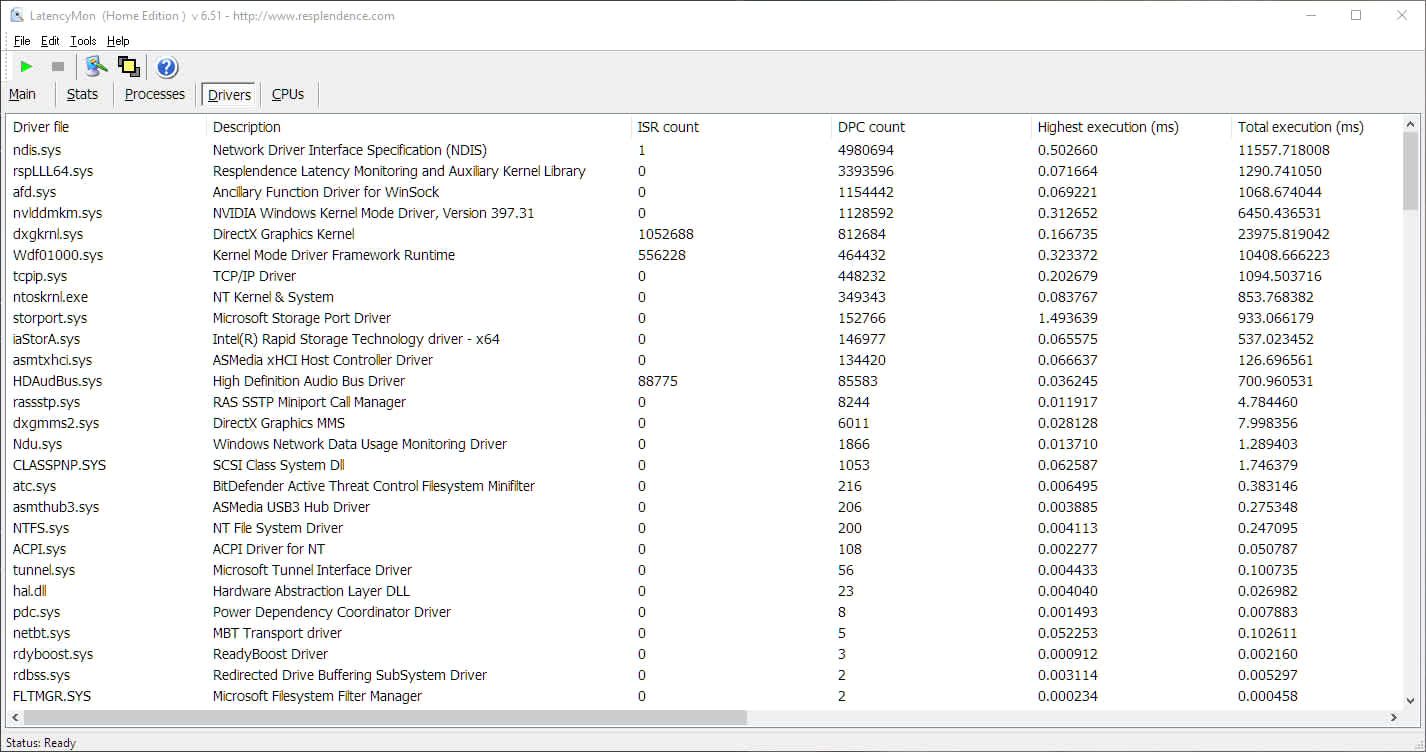
The driver at the top of LatencyMon's list is frequently not the driver causing your problem.
ntoskrnl.exe and Wdf01000.sys dominate the results on most systems, and both are frameworks that execute code on behalf of other drivers. Treating either as the culprit sends people down a week-long troubleshooting path that ends nowhere.
Quick answer: Ignore the highest total execution time and look at the highest DPC routine execution time for a single driver. Anything consistently above 1,000 microseconds will break real-time audio. Then work out which driver actually owns that work, because the framework hosting it is not the fault.
LatencyMon is worth running only if you have symptoms — crackling audio, periodic stutter, dropouts in recording. Chasing green numbers on a system with no symptoms is wasted effort, and some of the popular "fixes" cost you real security for no measurable gain.
Note
Key Takeaways
- Run LatencyMon as Administrator, with your normal background apps running, for at least 10 minutes.
- The number that matters is highest DPC routine execution time per driver, not total time or interrupt count.
ntoskrnl.exeandWdf01000.sysare frameworks. Their appearance at the top is normal and usually not actionable.- Network drivers are the most common genuine offender, particularly Wi-Fi adapters with power saving enabled.
- Memory Integrity (HVCI) inflates measured latency substantially. Disabling it helps the numbers and costs you real security protection.
What DPC Latency Actually Is
A DPC, or Deferred Procedure Call, is how Windows handles work that a hardware interrupt started but could not finish immediately.
When a device needs attention, it raises an interrupt. The Interrupt Service Routine (ISR) runs at very high priority, does the minimum necessary, and defers the rest to a DPC that runs slightly later at a lower priority. This keeps the system responsive while still servicing hardware promptly.
The problem is that DPCs cannot be interrupted by normal thread scheduling. While a DPC is executing, threads that need the CPU wait. A driver whose DPC routine takes several milliseconds is holding up everything else on that processor, and the visible result is an audio buffer that misses its deadline or a frame that arrives late.
Why audio breaks first
Real-time audio runs on a fixed buffer with a hard deadline. Miss it and you get a pop, click, or dropout — there is no way to catch up. That is why crackling audio is the classic DPC symptom and why it shows up long before anything else does. If that is your specific problem, our guide to game audio crackling while gaming covers the audio-side settings alongside this.
Frame delivery suffers the same way but is more forgiving, so DPC problems show up there as occasional hitching rather than constant noise.
Running It Correctly
Download LatencyMon from Resplendence directly. Then:
- Close nothing. Run it with your normal background applications active — the whole point is to catch what actually happens during real use.
- Right-click and Run as administrator. Without elevation it cannot read the kernel timing data it needs, which is the most common reason people report that it "does not work."
- Click the green play button and leave it for at least 10 minutes.
- Reproduce the symptom while it runs. If your audio crackles only in a specific game, play that game.
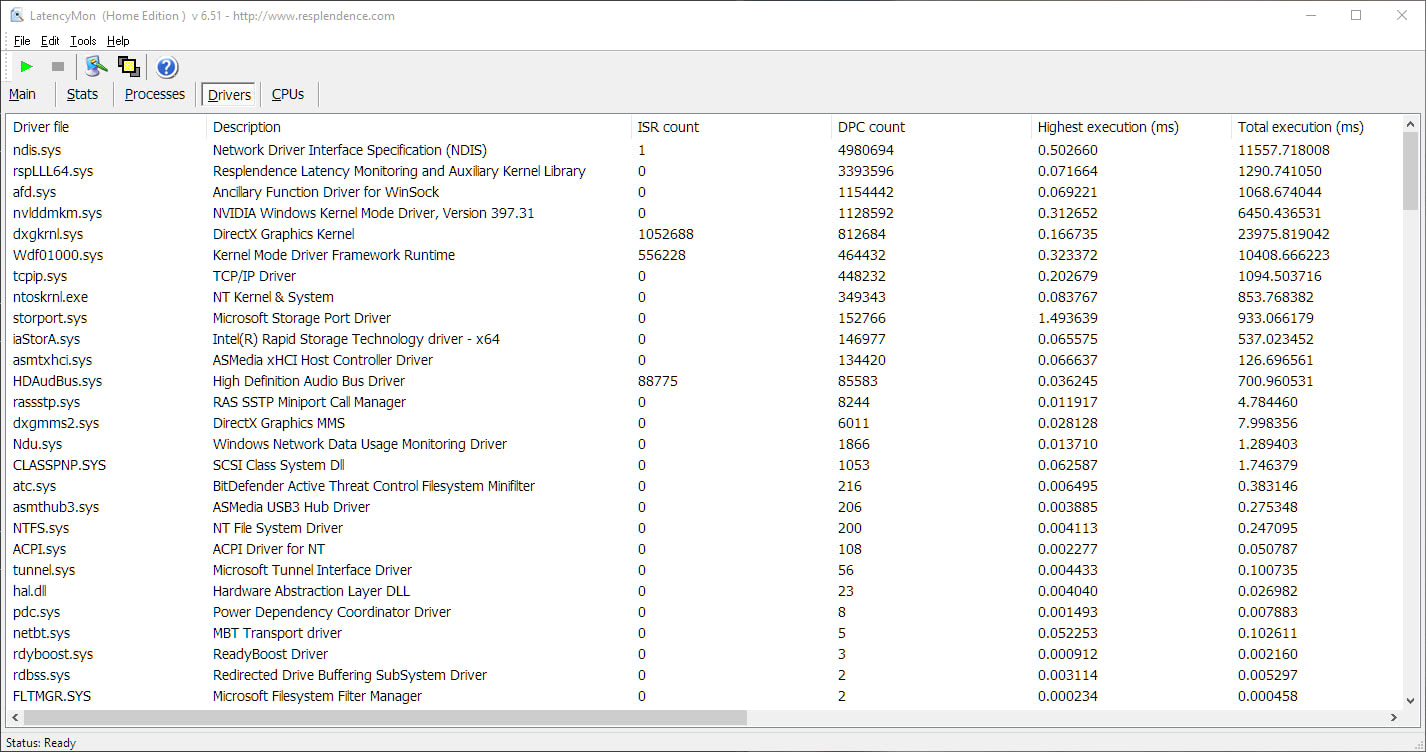
- Read the Drivers tab, sorted by highest DPC routine execution time.
Common reasons it appears broken
- Not elevated. Run as administrator, always.
- Running in a virtual machine. Measurements are meaningless there.
- Another monitoring tool is active. Overlays and sensor tools can conflict; close other latency or hardware monitors.
- Exclusive fullscreen. Use borderless windowed while measuring so the tool keeps sampling.
- Immediate red warnings on a fresh boot. Give it several minutes. Early readings are dominated by startup activity and are not representative.
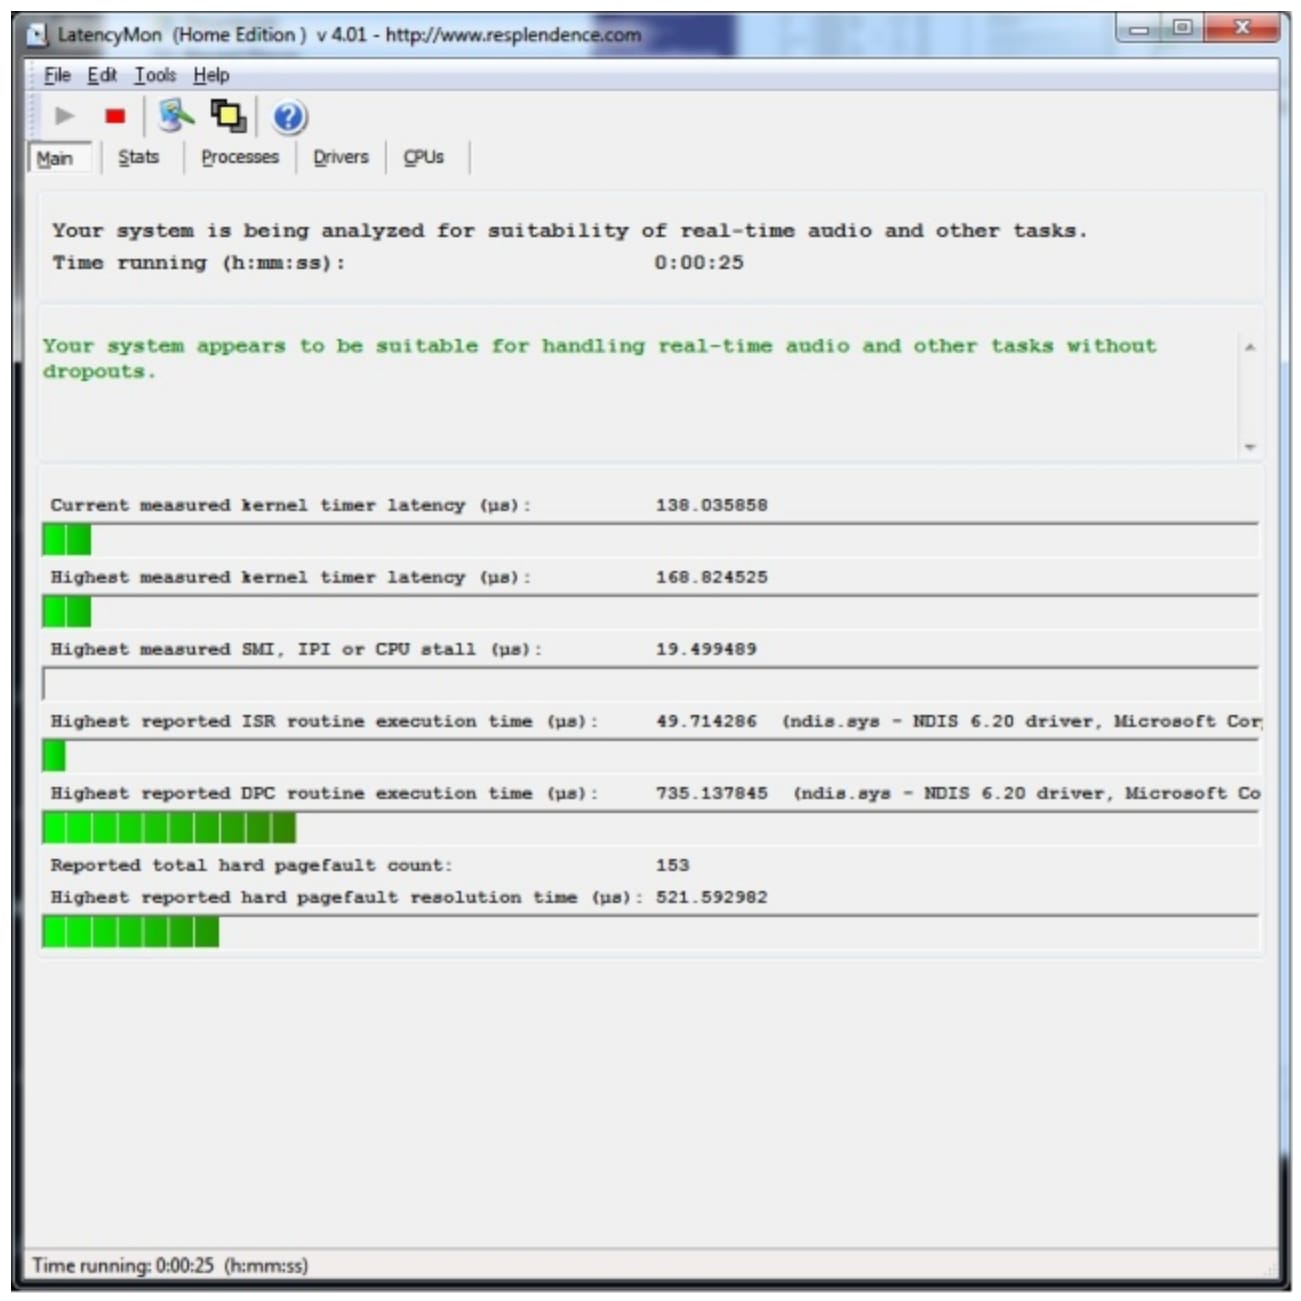
Reading the Numbers That Matter
LatencyMon presents several figures and only some of them are diagnostic.
| Metric | What it means | Act on it? |
|---|---|---|
| Highest DPC routine execution time | Longest single uninterruptible block, per driver | Yes — this is the one |
| Highest ISR routine execution time | Longest interrupt handler | Yes, if very high |
| Total execution time | Cumulative across the session | No — favours busy drivers |
| DPC count | How often it ran | No — high counts are normal |
| Highest measured interrupt-to-process | System-wide worst case | As a summary only |
Rough thresholds
- Under 200 microseconds — healthy. Nothing to do.
- 200 to 500 microseconds — normal on most consumer hardware.
- 500 to 1,000 microseconds — worth investigating if you have symptoms.
- Above 1,000 microseconds — will cause audible dropouts in real-time audio.
- Several milliseconds — a genuine fault. Find that driver.
Judge these on the sustained pattern rather than a single spike. One outlier during a driver load or a USB device connecting is not a problem; the same figure recurring every few seconds is.
The Framework Trap
This is the part that wastes the most time, so it is worth being precise about.
ntoskrnl.exe
The Windows kernel itself. It appears at or near the top on virtually every system because an enormous amount of legitimate work runs through it. Its presence is almost never actionable on its own. When it is genuinely high, the cause is usually power management or timer behaviour rather than the kernel being faulty.
Wdf01000.sys
The Kernel-Mode Driver Framework. Many third-party drivers are written against it, and their DPC time is attributed to the framework rather than to them. Seeing Wdf01000.sys at the top means "one of the drivers built on KMDF is slow" — it does not tell you which one.
To find the real owner, disable candidate devices one at a time in Device Manager and re-measure. Bluetooth radios, Wi-Fi adapters, RGB and fan controllers, capture cards, and audio interfaces are the usual suspects.
ACPI.sys
Power management. High values here typically point at aggressive C-state transitions or a firmware-level power feature, not at a broken driver.
dxgkrnl.sys and nvlddmkm.sys
Graphics. These rise under load and during mode changes. Genuinely high values usually indicate a driver problem, a display handshake issue, or something forcing repeated mode switches — a second monitor at a mismatched refresh rate does this reliably, which our guide to second-monitor FPS drops covers.
The Fixes That Actually Work
Ordered by how often they resolve real cases.
1. Network adapter power saving
This is the single most common genuine cause, and Wi-Fi adapters are worse than wired ones.
- Open Device Manager → Network adapters.
- Right-click your adapter and choose Properties.
- On the Power Management tab, clear Allow the computer to turn off this device to save power.
- On the Advanced tab, disable any power-saving, throttling, or "eco" mode.
If ndis.sys, tcpip.sys or a vendor-specific network driver is at the top of your list, do this first. If the problem persists, install the driver from the adapter manufacturer rather than the version Windows Update supplies — and try an older version, because network driver regressions are common.
2. Turn off Fast Startup
Fast Startup preserves a partial kernel state across reboots, which carries driver problems forward. Disable it in Control Panel → Power Options → Choose what the power buttons do, then perform a genuine restart to get a clean state.
3. Set the power plan to High Performance
C-state transitions and aggressive core parking both add latency. Switching to High Performance while measuring tells you quickly whether power management is involved. If it fixes the symptom, you can then decide whether the power cost is worth it.
4. Update firmware and chipset drivers
Motherboard BIOS and chipset drivers change how interrupts and power states are handled. Both are worth updating before you start disabling hardware, and both are commonly years out of date on systems that have never been touched since assembly.
5. Disable devices selectively
With Wdf01000.sys at the top, this is the only reliable way to find the owner. Disable one device at a time in Device Manager, re-measure for a few minutes, and re-enable before moving on. Start with Bluetooth, then Wi-Fi, then peripheral controllers.
Memory Integrity: The Honest Trade-Off
Disabling Memory Integrity (HVCI) under Windows Security → Device Security → Core Isolation measurably lowers reported DPC latency. It is widely recommended for this reason, and the recommendation is usually made without stating the cost.
Memory Integrity is a real security control. It uses virtualisation-based security to prevent malicious code from being injected into kernel-mode processes. Turning it off removes that protection permanently, not just while you measure.
The reasonable position:
- If you have no symptoms, leave it on. Lower numbers with no audible or visible benefit are not worth a security downgrade.
- If you have genuine dropouts and a professional audio workload where the machine is a tool rather than a general-purpose PC, it is a defensible trade.
- Test it temporarily to confirm it is the cause before deciding, then make the choice deliberately.
The same reasoning applies to the various "debloat" and "optimiser" scripts that disable it silently among dozens of other changes. Know what you are giving up.
When DPC Latency Is Not Your Problem
Plenty of stutter has nothing to do with DPC latency, and LatencyMon will happily report healthy numbers while your game still hitches.
Check these before going further:
- Shader compilation stutter on first play — covered in whether you should clear your shader cache.
- Frame pacing and traversal stutter — see how to fix stuttering in PC games.
- Network jitter mistaken for local stutter — low ping but laggy from bufferbloat and packet loss in online games cover the connection side.
- A GPU that is not being fed — low GPU usage while gaming covers CPU-bound cases.
Knowing which measurement describes your symptom matters: what 1% lows actually measure explains how to tell a delivery problem from a raw performance one.
Frequently Asked Questions
What is a good DPC latency figure?
Sustained DPC routine execution below about 200 microseconds is healthy, and anything under 500 is normal on consumer hardware. Above 1,000 microseconds you should expect audible dropouts in real-time audio. Judge the recurring pattern rather than a single spike, since isolated outliers during device events are ordinary.
Why does LatencyMon say ntoskrnl.exe is the problem?
It usually is not. ntoskrnl.exe is the Windows kernel and a very large amount of legitimate work is attributed to it, so it sits near the top on nearly every system. When it is genuinely elevated, look at power management, C-states and timer behaviour rather than assuming Windows itself is broken.
Why won't LatencyMon start or show any data?
The most common reason is that it was not run as administrator, since it needs elevation to read kernel timing data. It also produces meaningless results inside a virtual machine, can conflict with other hardware monitoring tools, and needs several minutes before its readings stop being dominated by startup activity.
Should I disable Memory Integrity to reduce DPC latency?
Only if you have actual symptoms and understand the cost. Memory Integrity prevents malicious code injection into kernel processes, and disabling it removes that protection for good. Test it temporarily to confirm it is responsible, then decide deliberately — do not disable it on a system that has no dropouts to fix.
Which driver causes high DPC latency most often?
Network drivers, and Wi-Fi adapters in particular. Power-saving features that let the adapter idle between packets produce exactly the periodic latency spikes that break audio buffers. Disabling adapter power management and installing the manufacturer's own driver resolves a large share of real cases.
The Bottom Line
Run LatencyMon as administrator for ten minutes with your normal workload, then read one number: highest DPC routine execution time per driver. Everything else on the screen is context.
If a framework like Wdf01000.sys is at the top, the tool is telling you a hosted driver is slow, not that the framework is broken — find the owner by disabling devices one at a time. Start with network adapter power saving, because it accounts for more genuine cases than everything else combined.
And apply the honest test throughout: if you have no crackling, no dropouts and no stutter, a red warning in LatencyMon is not a problem worth solving. Optimising a number you cannot hear is how people end up trading away security settings for nothing.
Screenshots courtesy of the respective software vendors, used for editorial coverage.
Sources
- Microsoft Learn, Introduction to DPC Objects, retrieved 2026-08-18, https://learn.microsoft.com/en-us/windows-hardware/drivers/kernel/introduction-to-dpc-objects
- Microsoft Learn, Interrupt Service Routines, retrieved 2026-08-18, https://learn.microsoft.com/en-us/windows-hardware/drivers/kernel/introduction-to-interrupt-service-routines
- Microsoft Learn, Kernel-Mode Driver Framework overview, retrieved 2026-08-18, https://learn.microsoft.com/en-us/windows-hardware/drivers/wdf/kernel-mode-driver-framework
- Microsoft Learn, Enable virtualization-based protection of code integrity, retrieved 2026-08-18, https://learn.microsoft.com/en-us/windows/security/hardware-security/enable-virtualization-based-protection-of-code-integrity
- Resplendence Software, LatencyMon: real-time audio suitability checker, retrieved 2026-08-18, https://www.resplendence.com/latencymon